
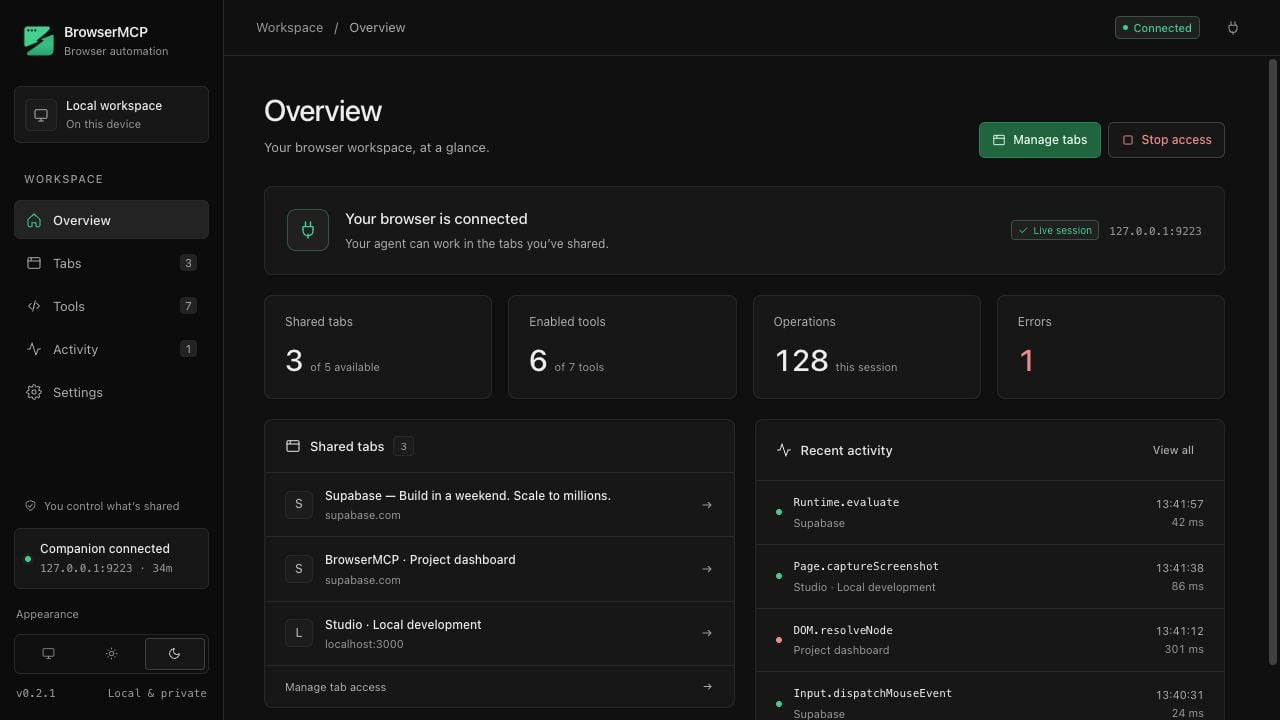
Connection card
Shows whether the extension is connected to the companion (127.0.0.1:<port>), reconnecting, or stopped, how long the session has been live, and the companion version. Stop and Resume are the same emergency controls as on the Settings page.
Setup
A client picker (Claude, Codex, OpenCode, Cursor, Kilo, Antigravity) with the exact command or JSON to paste, a copy button, the file it belongs in, what to do next, and a link to that client’s MCP documentation. The snippets already include--port when you changed the bridge port. Full text of each is in Connect an agent.
Numbers
Shared tabs and attached tabs are always shown. Operations and Errors count commands since the extension started and appear only while the activity log is on; with it off nothing is counted.Stale worker banner
When you rebuild the extension without reloading it, the files on disk are newer than the running service worker. The dashboard detects the version mismatch and shows a banner asking you to reload the extension onchrome://extensions. The same banner appears when the running worker predates a setting the dashboard expects.